ITSRG WebMaps
Here is our collection of web maps we have created and discussed. Click on the map to see a larger version.
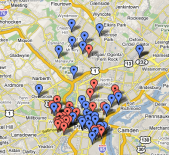
Visualization of Inauguration Tweets Across US
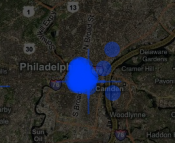
ITSRG has discussed extensively the use of Twitter during the democratic primary season and the presidential election campaign. We have also posted several related maps via our twitter feed, http://twitter.com/itsrg. Here is one that captures the trend of increasing use of social media for political organizing and communication created by Jeff Clark of Neoformix. It is an animated visualization of location and content of tweets that occurred during the inauguration ceremony. You can zoom in on specific locations from which tweets originated and hover over dots to see tweet content. You can track comments by the ceremony agenda.
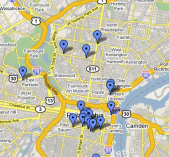
Cheap Milk in NYC
ITSRG has been following the use of volunteered data in web accessible maps to track the impacts of the deep recession impacting our nation and the world. This map is one of milk, lettuce and beer prices. Our post also features Trulia's heat island map that shows the degree to which housing price inequality is localized, a USA today foreclosures map, and a recent map of journalist layoffs.
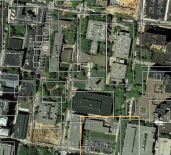
Green Spaces in North Philadelphia
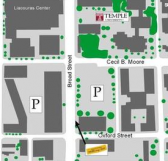
Jonathan Otto, a graduate student in the Geography and Urban Studies department and ITSRG cartographic intern, created this map of green spaces in Philadelphia to accompany our Park(ing) Day 2008 event. More information on Parking Day can be found at http://plantyourpark.tumblr.com, the site we developed to capture perspectives on the event. The site was developed by ITSRG, the images and content were created by our staff and students from Fall 2008 Environmental Policy Issues seminar held at Temple University.
Philadelphia Parks
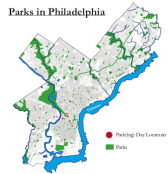
Jonathan Otto, ITSRG Cartographic Intern and graduate student in Geography and Urban Studies at Temple University, created this map of green spaces and parks across the whole city of Philadelphia. The map was drawn from an ArcGIS shape file, we adapted colors to reflect the design schema of the ITSRG Park(ing) Day 2008 event as disseminated across our websites and social media outlets.
Farmers Markets in Philadelphia
Farmers Markets in Philadelphia was created in May 2008 by students from the BITS Program as part of a summer field experience aimed at teaching high school students about local landscapes, food practices, and public health.
African American Sites of Memory
African American Sites of Memory was created in July 2008 by students from the BITS Program. They studied and blogged about many of these sites as part of their hands-on experiences to learn about the cultural and historical influence of African Americans in North Philadelphia and beyond.
Wildfires in California
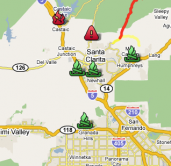
In June, 2008, we commented on the value of using social media to help communities and emergency responders address information needs on the ground in real time. This map is part of the Los Angeles Fire Department's overall web 2.0 outreach strategy, which we showcased in this blog post and at this workshop last year.
E-Pumpkins on the East Coast
On October 31, 2007, the BITS Program sponsored an e-pumpkin carving competition. Philadelphia area high school students, Temple University undergraduate students, and kids at St. Chritopher's Children's Hospital all participated in creating drawings of carved pumpkins using a web carving tool. The images they created were converted into .jpg formatted files and sent to ITSRG. BITS Students created this mash-up of the locations from which pumpkins were entered as well as ones we received from across the country through our parallel e-competition. The pumpkins were judged by ITSRG, winners announced, and prizes given to the most innovative ones. We donated all the pumpkins to St. Chris's, where BITS students worked with children staying at the hospital to create their own virtual pumpkins.
BITS Program Wikimapia Sites
During the Fall of 2006 and Spring of 2007, high school students from the BITS Program annotated Temple University's campus and surrounding area to create a contribution to Wikimapia. Wikimapia is an open source map labeling web site that supports collaborators to share tags, links, and annotations on specific places linked to the map. Click the image to the side in order to see some of the spots BITS students labeled. Here is our blog post related to the activity they engaged.
ITSRG Comments on Gas Maps
In June, 2008, as gas prices began to increase dramatically in the U.S., we began a commentary on the importance of cartographers and geographers entering into the discussions about web map resources. We highlighted the ironies of map tools, like Gas Buddy, being used by consumers to mitigate high costs of Gasoline. We also commented on maps compiled within the media depicting a growing crisis and the geographic distribution of impacts. Click here to see our full discussion of consumer created maps.
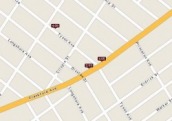
Geographic Disparities in Gas Prices - 2008
Last June and July, gasoline prices soared in the U.S. Wilcox County, Alabama (shown in the map to the side) was cited by the New York Times as the county where residents were paying the highest costs for gasoline as a percentage of their income. We commented on the underlying social and geographic inequalities that have persisted in Wilcox County, continuing our prior Gas Maps discussion. We emphasize that the web is a powerful medium for illuminating such disparities, but that there is also a strong need for geographers and cartographers, along with other social scientists, to enter the conversation so that more in-depth understanding of the persistent challenges faced by Wilcox County and other settings like it face in hard economic times.
